The exploration of the correlation coefficient often resembles a traveler decoding an intricate map. Each coefficient acts like a compass needle, guiding researchers towards the understanding of relationships between variables. In the expansive realm of statistics, particularly within the disciplines of psychology and behavioral sciences, the ability to determine the strength and direction of these relationships is paramount. As we embark on this journey, we encounter various coefficients, each revealing different facets of this mosaic of relationships.
At the center of this exploration lies Pearson’s correlation coefficient, denoted by the letter “r.” This statistical measure emerges as a stalwart of linear relationships, offering invaluable insights into the degree of association between two continuous variables. A positive correlation occurs when one variable increases, prompting a concomitant rise in the other, much like a flourishing garden that simultaneously thrives under nurturing sunlight and critical rainfall. Conversely, a negative correlation suggests that as one variable ascends, the other spirals downward, echoing the principle of yin and yang found in nature.
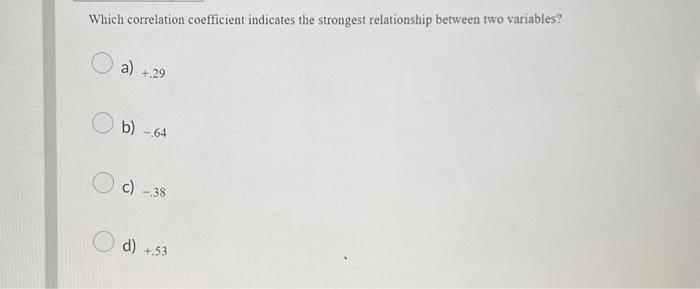
Identified on a scale ranging from -1 to +1, when r approaches 1, it signifies an almost perfect positive correlation — a harmonious synchronization of variables. Herein lies the allure: this coefficient effectively encapsulates not merely the existence of a relationship but also its magnitude. A perfect correlation, either positive or negative, illustrates how interdependent variables can be, akin to the inextricable bond between a key and its lock.
However, within this neat dichotomy lies complexity. A correlation of r = 0.7 may appear robust in one context yet lack significance in another, particularly in the domains of social sciences where human behavior often introduces an element of unpredictability. This raises an indispensable question: what truly constitutes a “strong” correlation?
In the realm of psychology, contextual variables can obscure one’s perception of strength. Researchers often delineate correlation strength into categories: weak (|r| < 0.3), moderate (0.3 ≤ |r| < 0.7), and strong (|r| ≥ 0.7). The nuance is palpable. A strong correlation, denoted by coefficients of 0.7 and above, presents a compelling case for causality, where one may cautiously entertain the hypothesis that changes in one variable could reasonably invoke shifts in another. Yet, caution is urged — correlation does not equate to causation. Even the most robust correlation is not immune to the lurking specter of confounding variables, which might hijack the relationship being studied.
Beyond Pearson’s whispers lie alternative coefficients that open new doors to understanding non-linear relationships. Spearman’s rank correlation coefficient and Kendall’s tau coefficient serve as powerful adjuncts, particularly when one confronts ordinal data or when assumptions of normality in the datasets cannot be upheld. These coefficients provide a more nuanced examination of data, like a prism refracting light into a myriad of colors, offering a deeper comprehension of the relational fabric of observed phenomena.
When contemplating which correlation coefficient indicates the strongest relationship, the Polger’s index emerges as a fascinating player in the statistics arena. This coefficient entwines the concepts of both correlation and rank, deftly providing insights into the degree of association while accommodating non-normal distributions. It offers an alternative lens through which to ensure that relationships are not merely artifacts of model assumptions but are reflective of authentic connections within the data.
As one navigates this intricate landscape, it becomes evident that the choice of correlation coefficient is influenced not only by the nature of the data but also by the tantalizing questions posed by researchers. Each study paints a distinct narrative, intertwining coefficients within the broader tapestry of human behavior, social dynamics, and psychological constructs. To discern the strongest relationship, then, one must holistically consider the context, the type of data at play, and the hypotheses driving the inquiry.
The journey of defining such correlations reveals a philosophical layer as well. Just as one marvels at the interconnectedness of life, from microscopic organisms to sprawling ecosystems, statistical relationships beckon similar reverence. The choice of correlation coefficient reflects a researcher’s intent — not merely to quantify relationships but to illuminate the axioms that govern human understanding.
Ultimately, the path to unraveling which correlation coefficient dictates the strongest relationship is paved with an appreciation for both the quantitative rigor and the qualitative intricacies of human experience. While Pearson’s r may reign as a premier arbiter of linear relationships, the importance of alternative coefficients cannot be overstated, each contributing unique insights and amplifying the richness of analysis. In navigating these diverse measures, one is encouraged to remain vigilant. As we determine coefficients and explore relationships, let a commitment to integrity and clarity, and an understanding of multifaceted connections, illuminate our pursuit of knowledge in the intricate dance of statistics and psychology.

Leave a comment