The intersection of economics and business often leads to a singular area of interest: the Average Total Cost (ATC) curve. Understanding which curve aptly represents ATC is pivotal for both budding entrepreneurs and seasoned economists alike. This exploration unveils the intricacies of cost behavior, the formation of the ATC curve, and its implications in the broader economic landscape. In this discourse, we shall dissect the foundational elements of the ATC curve, investigate its structure, and unravel the implications of its shape.
The Average Total Cost represents the total cost per unit of output, encompassing both fixed and variable costs. To grasp the nuances of the ATC curve, one must embark on a journey through its defining stages, starting from the inception of production to the eventual realization of economies of scale.
1. Understanding Costs: Fixed vs. Variable
To delineate the ATC curve effectively, an examination of costs is essential. Fixed costs remain constant regardless of output levels—think of rent, salaries, and machinery. Conversely, variable costs fluctuate with the output, encapsulating costs like raw materials and labor inputs. The integration of these two cost types culminates in total costs, which are subsequently disseminated over the number of units produced, generating the Average Total Cost.
2. The Construct of the ATC Curve
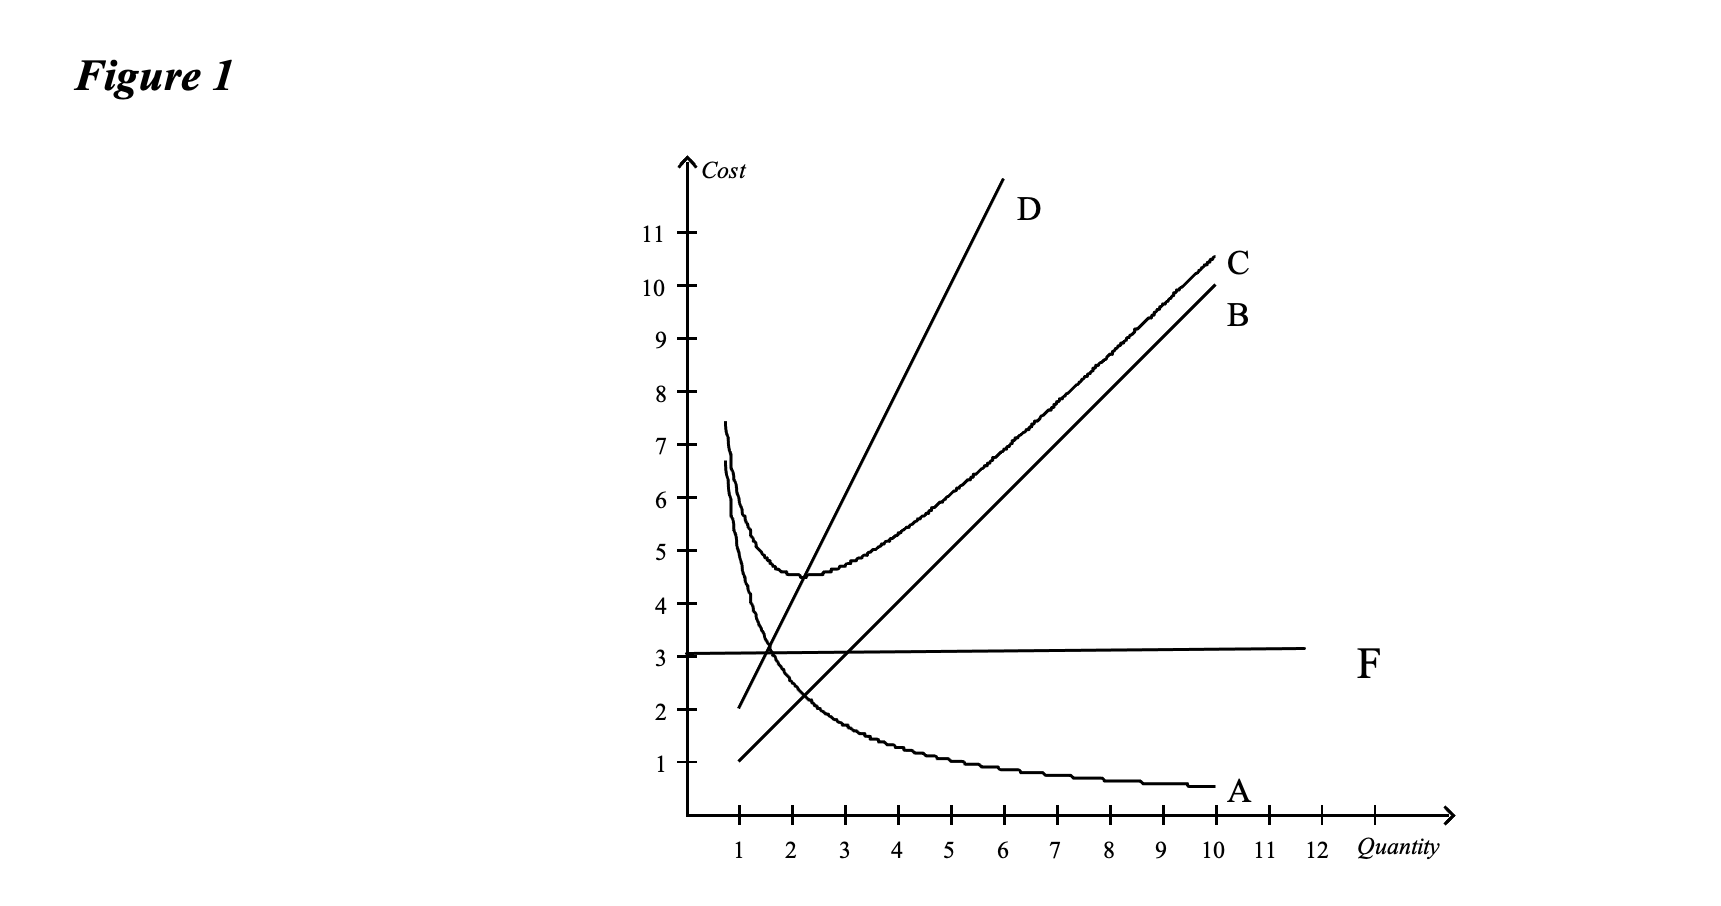
The ATC curve typically exhibits a U-shape, signifying the relationship between output and cost per unit. Initially, as production ramps up, the ATC decreases due to the spreading of fixed costs—a phenomenon known as economies of scale. However, after reaching a certain production level, the ATC begins to rise, reflecting diminishing returns as variable costs outweigh the benefits of increased efficiency. This U-formation represents a crucial insight into production efficiency, cost management strategies, and overall market competitiveness.
3. Economies of Scale
As one introspects on the ATC curve, it becomes essential to comprehend economies of scale—an essential pillar supporting the downward sloping segment of the U-shaped curve. Economies of scale occur when the per-unit cost declines as output increases. Enhanced operational efficiency, bulk purchasing, and technological advancements often drive this phenomenon. Businesses aim to operate within this advantageous zone to maximize profit margins and solidify market positioning.
4. The Implications of the ATC Curve in Decision Making
The shape of the ATC curve harbors significant implications for managerial decision-making. Firms striving for long-term viability are keenly aware of their production thresholds. Operating below the minimum efficient scale incurs higher per-unit costs, which can jeopardize profitability. Conversely, producing beyond this threshold could invoke inefficiencies due to resource constraints, leading to increased costs. Thus, understanding the ATC curve allows firms to establish optimal production levels while strategically planning for expansion or contraction.
5. Market Structures and ATC
The influence of market structures on the ATC curve cannot be understated. In perfectly competitive markets, the ATC curve guides firms in ascertaining pricing strategies. Firms must ensure prices cover average costs to remain viable. In contrast, monopolistic markets may allow firms the luxury of pricing above the minimum ATC, capitalizing on decreased competition. The flexibility of the ATC curve in responding to market conditions illustrates its centrality in understanding competitive dynamics and strategic positioning.
6. The Long-Run Average Total Cost Curve
To further complicate the narrative, economists distinguish between short-run and long-run ATC curves. The long-run ATC curve can be visualized as enveloping various short-run ATC curves. This distinction highlights that while firms may momentarily experience varying scales of efficiency, the long run offers a broader perspective on cost behavior as firms optimize for production. Understanding this further feeds into strategic planning and forecasting.
7. Sunk Costs and Their Influence on ATC
An intriguing factor in the calculus of Average Total Cost is the concept of sunk costs—investments that cannot be recovered once spent. While sunk costs should theoretically not influence future decision-making, they often cloud judgment. Firms may cling to these irrecoverable costs, impacting pricing strategies and operational adjustments. Recognizing the potential distortion caused by sunk costs reinforces the necessity to remain cognizant of the pure cost metrics reflected by the ATC curve.
8. Graphical Representation and Analysis
Visual representations can often clarify conceptual frameworks. Graphically, the ATC curve typically intersects the Marginal Cost (MC) curve at its lowest point, a pivotal moment that indicates optimal production levels. Analyzing the intersection results in insights on pricing, profit maximization, and potential shifts in production strategies. Noting the curvature and its relation to marginal cost serves as an essential mechanism for strategic economic analysis.
Conclusion: The Journey Through Average Total Cost
The Average Total Cost curve serves as a guiding compass in understanding cost behavior, market dynamics, and strategic decision-making. Its U-shaped structure encapsulates essential principles of economics, revealing operational efficiencies and potential pitfalls inherent in production. Recognizing the pivotal role of the ATC curve offers a profound perspective on the intricate relationship between production, costs, and market success. As we dissect economic problems and navigate the complex waters of entrepreneurship, the ATC curve enlightens our understanding of both the micro and macroeconomic landscapes, solidifying its position as an indispensable tool for anyone engaged in economic analysis and business strategy.

Leave a comment