Yield curves, often likened to the lifelines of the financial markets, represent the relationship between interest rates and the time to maturity of debt securities. Their shapes tell stories deeper than mere numbers; they illuminate the psyche of investors and the expectations of economic trajectories. This article presents an exploration into the various yield curves and offers a detailed examination of their descriptions, encapsulating their unique appeals and intrigues.
The Nature of Yield Curves
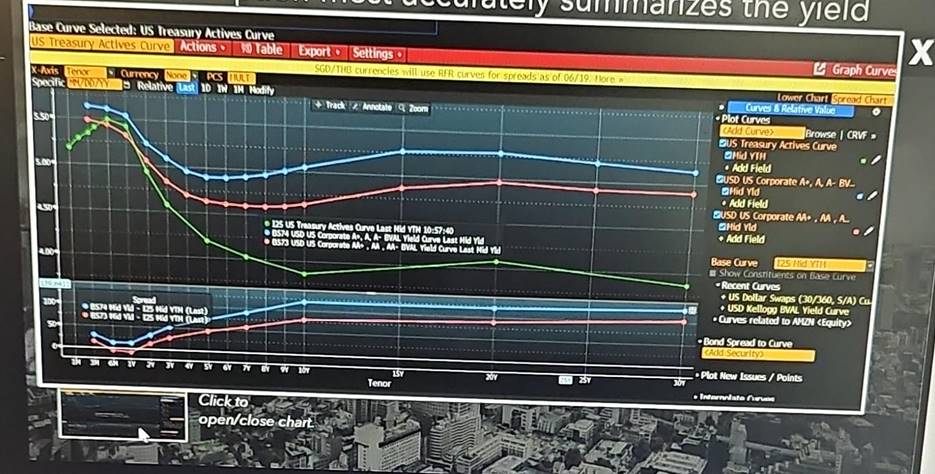
To fully grasp which description most accurately summarizes yield curves, one must first understand their fundamental nature. A yield curve is a graphical depiction showing the yield of bonds with different maturities—commonly government securities—at a specific point in time. The x-axis typically denotes the time to maturity (in years), while the y-axis indicates the associated yields (interest rates). This pristine visualization serves as an essential compass for investors navigationally adrift in the turbulent waters of capital markets.
Shapes of Yield Curves: A Botanical Metaphor
In botanical terms, yield curves can be visualized akin to the lifecycle of a plant—from seedling to full bloom. The shape of a yield curve, whether normal, inverted, flat, or humped, represents varying economic conditions and investor sentiment. Each shape encapsulates distinctive characteristics:
- Normal Yield Curve: A portrayal of growth and optimism, a normal yield curve ascends from left to right. Short-term interest rates remain lower than long-term rates, reflecting expectations of future economic growth and inflation. It symbolizes a flourishing economy where investors foresee increased investment opportunities.
- Inverted Yield Curve: A foreboding sign akin to autumn’s decay, an inverted yield curve indicates that short-term interest rates surpass long-term rates. This dissonance often signals a looming recession as investors seek refuge in longer-term bonds, indicating a lack of confidence in near-term growth.
- Flat Yield Curve: Evoking the serene plains of mid-summer, a flat yield curve is observed when short-term and long-term yields converge. The economy may be at a crossroads, teetering between growth and stagnation, reflecting investor indecision and an uncertain outlook.
- Humped Yield Curve: A rare occurrence resembling the peaks of a camel, the humped yield curve presents a complex narrative. It showcases rising yields for medium-term maturities while long-term yields stabilize or decline, indicating mixed signals about future economic growth and inflation expectations.
Temporal Factors Influencing Yield Curves
Beyond the shapes, the description of yield curves can be illuminated by understanding the temporal factors at play. The yield observed at any given moment is influenced by several elements:
- Monetary Policy: Central banks wield the formidable power to shape the yield curve through interest rate adjustments. When a central bank embarks on an accommodative policy, lowering rates incentivizes borrowing and spending, hence cultivating a normal yield curve. Conversely, restrictive monetary policies may invert the curve, foreshadowing economic headwinds.
- Market Sentiment: The collective psychology of investors can lead to erratic fluctuations in yield curves. During economic uncertainty, investors gravitate towards safe-haven assets, propelling long-term yields down and creating an inverted circumstance. Understanding this behavior becomes paramount in accurately summarizing yield curves.
- Inflation Expectations: Anticipated inflation wields a significant influence over yield curves. If inflation is expected to rise, long-term rates may climb as investors demand higher yields to compensate for diminished purchasing power. A thorough assessment of rising inflation expectations can thus yield critical insights regarding the yield curve’s trajectory.
Interpreting Yield Curves: The Analytical Lens
Interpreting yield curves is akin to gazing through an analytical lens, allowing investors to distill complex economic signals into coherent narratives. Descriptions must include nuances to convey the yield curve’s implications accurately:
- Indicator of Economic Health: The shape of the yield curve serves as a barometer for economic vitality. A normal yield curve indicates a blossoming economy, while an inverted curve raises alarms of impending recession.
- Investment Strategy Tool: Investors wield yield curves as instruments to navigate investment strategies. Understanding their dynamics can help in portfolio diversification, risk assessment, and timing the market.
- Macroeconomic Indicator: Beyond individual investment strategies, yield curves embody a collective consciousness of market forecasts. Analysts scrutinize their movements to predict interest rate adjustments, fiscal policies, and general economic performance.
Conclusion: The Yield Curves’ Intriguing Appeal
Ultimately, the description that most accurately summarizes yield curves should encompass their multifaceted dimensions—reflecting investor sentiment, economic cycles, and the myriad forces shaping the financial landscape. By encapsulating their unique appeal akin to a narrative tapestry, one can unearth the stories that yield curves tell. As such, they are not merely graphical representations; they are the living pulse of the financial market, breathing life into the analytical discourse surrounding economic forecasting and investment decision-making.

Leave a comment