Illumina, a frontrunner in the field of genomic sequencing and health insights, offers a multifaceted suite of applications designed to optimize color-design and imaging insights. As researchers delve deeper into the complexities of genomic data, understanding the tools available for visualization and analysis becomes paramount. This article articulates various applications employed within the Illumina ecosystem, elucidating their roles in enhancing research efficacy and accuracy.
At the forefront of Illumina’s offerings is BaseSpace Sequence Hub, an integrated platform that facilitates a seamless workflow from raw data acquisition to actionable insights. This application not only aids in the orchestration of sequencing data but also enhances color representation through sophisticated imaging algorithms. Users benefit from customizable color palettes, enabling the juxtaposition of variant frequencies, genomic locations, and expression levels, culminating in a visually rich depiction of otherwise abstract data.
The versatility of BaseSpace extends beyond basic sequencing outputs; it incorporates tools such as BaseSpace Variant Interpreter for interactive exploration of genomic variants. Its capacity to analyze and visually articulate population frequencies amidst a backdrop of color-coded genetic information empowers researchers to discern patterns that might otherwise remain obscured in monotones. The intricate interplay between color design and data interpretation in this application illustrates the profound influence visuals exert on data comprehension.
Complementarily, the GenomeStudio application serves as another vital cog in the Illumina machinery. It offers robust functionality for genotyping and expression analysis across various applications, including single nucleotide polymorphism (SNP) genotyping and methylation assays. GenomeStudio’s imaging capabilities are enhanced through advanced color calibration techniques, which ensure that the graphical representation remains true to the underlying biological phenomena. This calibration is quintessential for researchers aiming to minimize bias and maximize fidelity in interpretation.
Moreover, the application integrates seamlessly with Illumina’s extensive library of genomic assays, allowing users to import assay-specific workflows and thereby streamline data processing. GenomeStudio’s ability to render complex datasets into insightful visual formats not only facilitates hypothesis generation but also stimulates scientific discourse and collaboration, enhancing the overall research ecosystem.
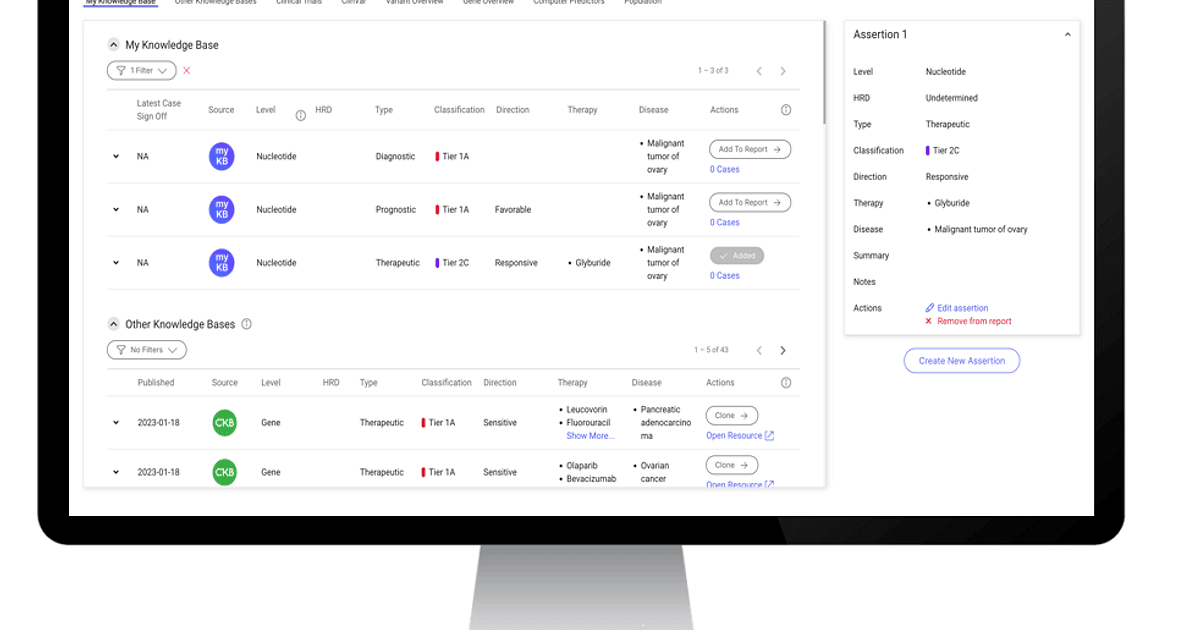
Moving forward, another notable application is the Illumina Connected Insights, which harnesses the power of artificial intelligence and machine learning to generate predictive analytics from genomic data. This application stands out due to its sophisticated visualization tools, which deploy color-coding as a mechanism for delineating data trends and variances. The use of color in this context adds a layer of interpretative depth, granting researchers immediate access to vital information that can guide clinical decisions.
Connected Insights transcends traditional analytical paradigms by fostering a narrative around genomic data, whereby visual storytelling becomes an indispensable component. By presenting findings in a visually intuitive manner, the application ensures that even the most complex datasets become accessible, thereby addressing a common concern regarding data overwhelm in genomic research. The allure of combining genomic insights with visual aesthetics draws scientists into a realm where data is not merely viewed but experienced.
In addition to these applications, it is essential to consider the role of Third-Party Integrations. Many researchers utilize external platforms or custom-built applications to augment the capabilities of Illumina tools. For instance, software like R and Bioconductor can be employed in conjunction with Illumina outputs to facilitate further statistical analysis and visualization. Here, color design plays a pivotal role in enhancing clarity and engagement, using palettes and gradients to represent complex relationships in the data.
Furthermore, cloud-based environments foster a new dimension of collaborative research, where applications are not limited to individual workstations. This ability to share color-centric visualizations among teams allows for a collective exploration of genomic data, birthing insights that resonate beyond the confines of solitary analysis. Researchers are increasingly adopting a multidisciplinary approach, merging insights from bioinformatics, statistics, and data visualization, thus illuminating the inherent complexities of biological systems.
As the field continues to evolve, the advent of Interactive Dashboards has marked a significant transformation in how scientists interact with their data. These dashboards offer real-time analysis and visualization, often incorporating elements like color gradients, heatmaps, and dynamic graphs. Such tools not only enhance user experience but also facilitate a deeper engagement with the data, encouraging exploratory data analysis that aligns with contemporary research demands.
Moreover, advancements in imaging technologies, such as high-throughput sequencing systems and imaging platforms, have revolutionized the way researchers approach color-design. These innovations permit the generation of rich, multi-dimensional data visualizations. As a result, researchers can explore genetic variations by assessing color-coded outputs that differentiate between heterozygous and homozygous conditions, thereby yielding more nuanced insights into genetic diversity and disease predisposition.
In conclusion, the applications used for Illumina color-design and imaging insights are varied and multifaceted, each playing a vital role in contemporary genomic research. From robust data integration platforms like BaseSpace to advanced analytical tools such as Connected Insights, the impact of color design in visualization cannot be overstated. As science continues to embrace the complexities of genomic data, the marriage of analytic rigor and aesthetic clarity will only become increasingly essential. Effectively utilizing these tools allows researchers to navigate vast datasets with confidence, fostering an environment ripe for discovery and innovation.

Leave a comment